The short version
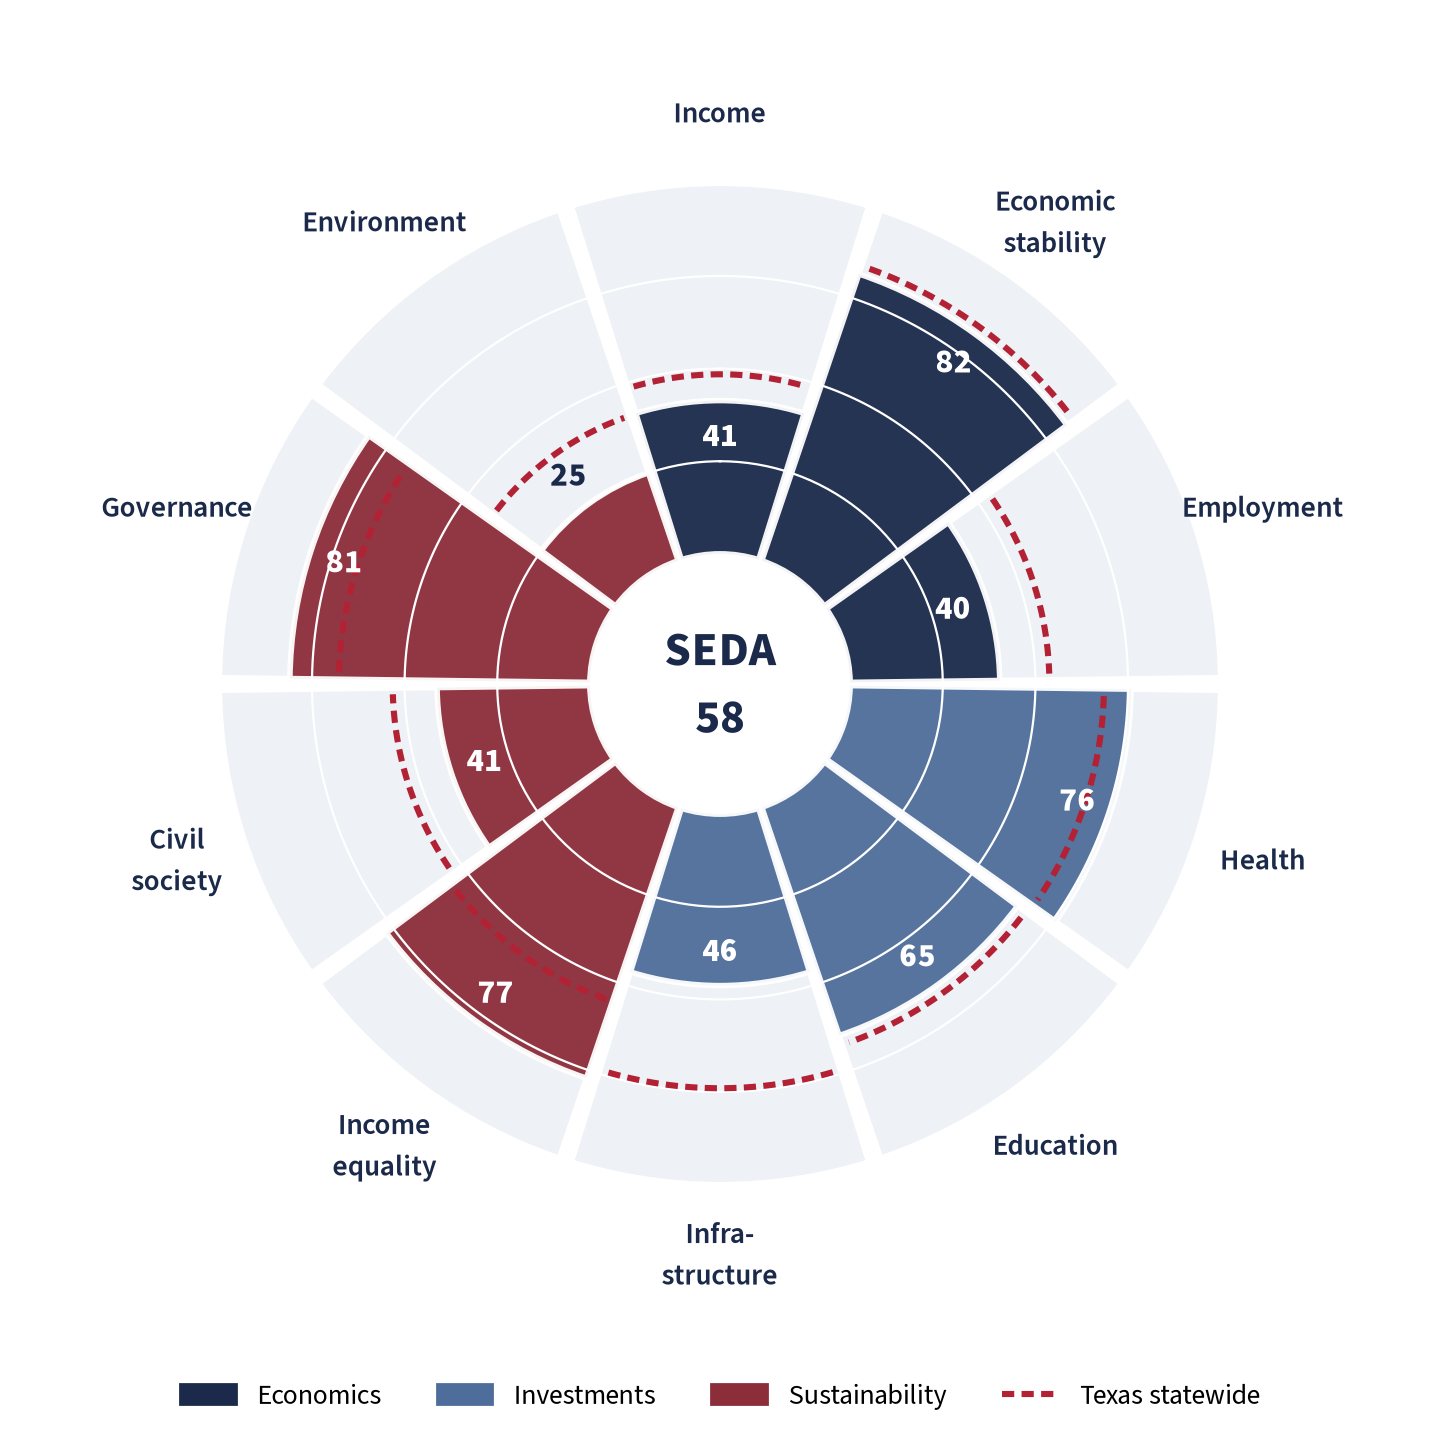
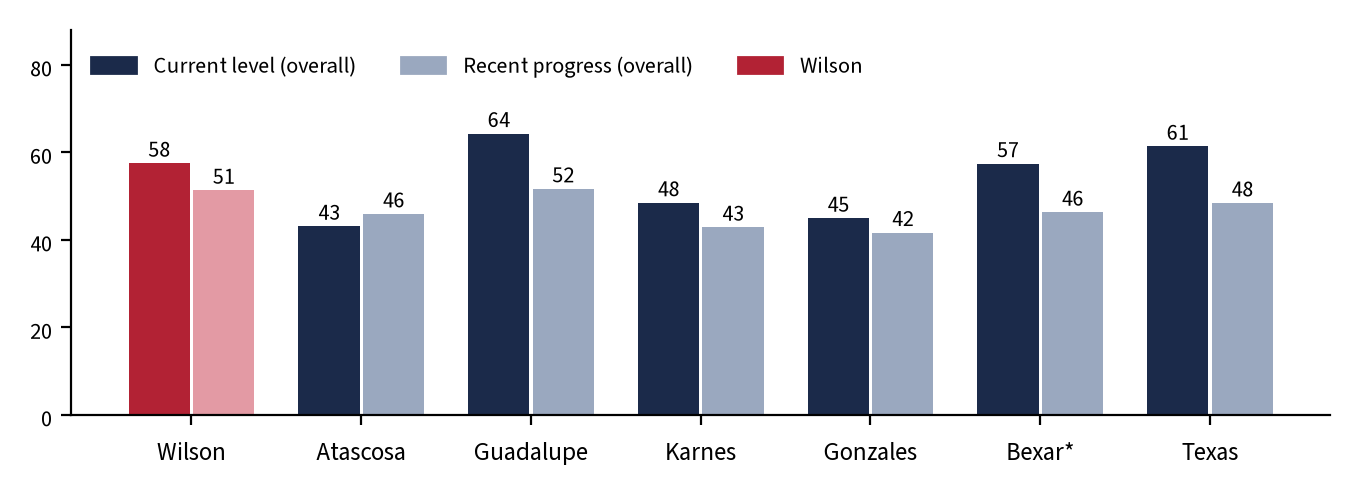
Wilson County scores 58 of 100 on this county-level adaptation of BCG’s SEDA framework (rank 94 of 254 Texas counties), slightly below the Texas statewide reference of 61. Its recent-progress score is 51 (rank 135 of 254; Texas 48). Among the four rural and exurban peer counties, Wilson trails only Guadalupe on current level and is ahead of Atascosa, Karnes and Gonzales. Scores are relative: 100 means at or above the 95th percentile of Texas counties, 0 means at or below the 5th percentile.
Six findings stand out:
- Well-off households, thin local economy. Median household income is $94,565 (Texas $78,476; rank 15 of 254) [S5], but GDP produced in the county is only $30,776 per resident (Texas $88,517) [S2, S1], and there are just 0.40 in-county jobs per employed resident (rank 251 of 254) [S4, S5]. Wilson functions largely as a bedroom county for the San Antonio region.
- Long commutes are the single weakest indicator. 35.5% of workers commute 45 minutes or more (Texas 16.9%; the 5th-highest share among 254 Texas counties) [S5]. County crashes reached a 10-year high of 646 in 2025, with injury-severity crashes up from 140 (2019) to 224 (2025) [S20].
- Strong health, education and equality positions. The uninsured rate is 13.2% vs. 18.6% statewide [S7]; 89.8% of adults have a high-school diploma [S5]; the Gini index is 0.427 vs. 0.478 [S5].
- Income growth is lagging. Per-capita personal income rose 22.4% from 2019 to 2024 vs. 31.1% statewide (rank 197) [S1]; the poverty rate rose from 9.6% to 11.3% between the 2015-19 and 2020-24 Census surveys [S5, S6].
- The fiscal position is conservative. County tax-supported debt is about $81 per resident (FY2025; county-sector average $531) [S11, S1]; the 2025 county rate of $0.4060 per $100 is below the statewide county median ($0.4928) [S12].
- Growth pressure is arriving in and near Precinct 4. A 600-MW, roughly 6,100-acre solar project in Precinct 4 received a 10-year abatement in July 2025 [S23]; a data-center, solar and gas complex is proposed about 6 miles north of Stockdale, in Precinct 3 per the county record [S26, S31]. The regional water plan projects Wilson’s population rising from 55,858 (2030) to 86,407 (2080) [S18].
The scorecard: Wilson vs. peers and Texas
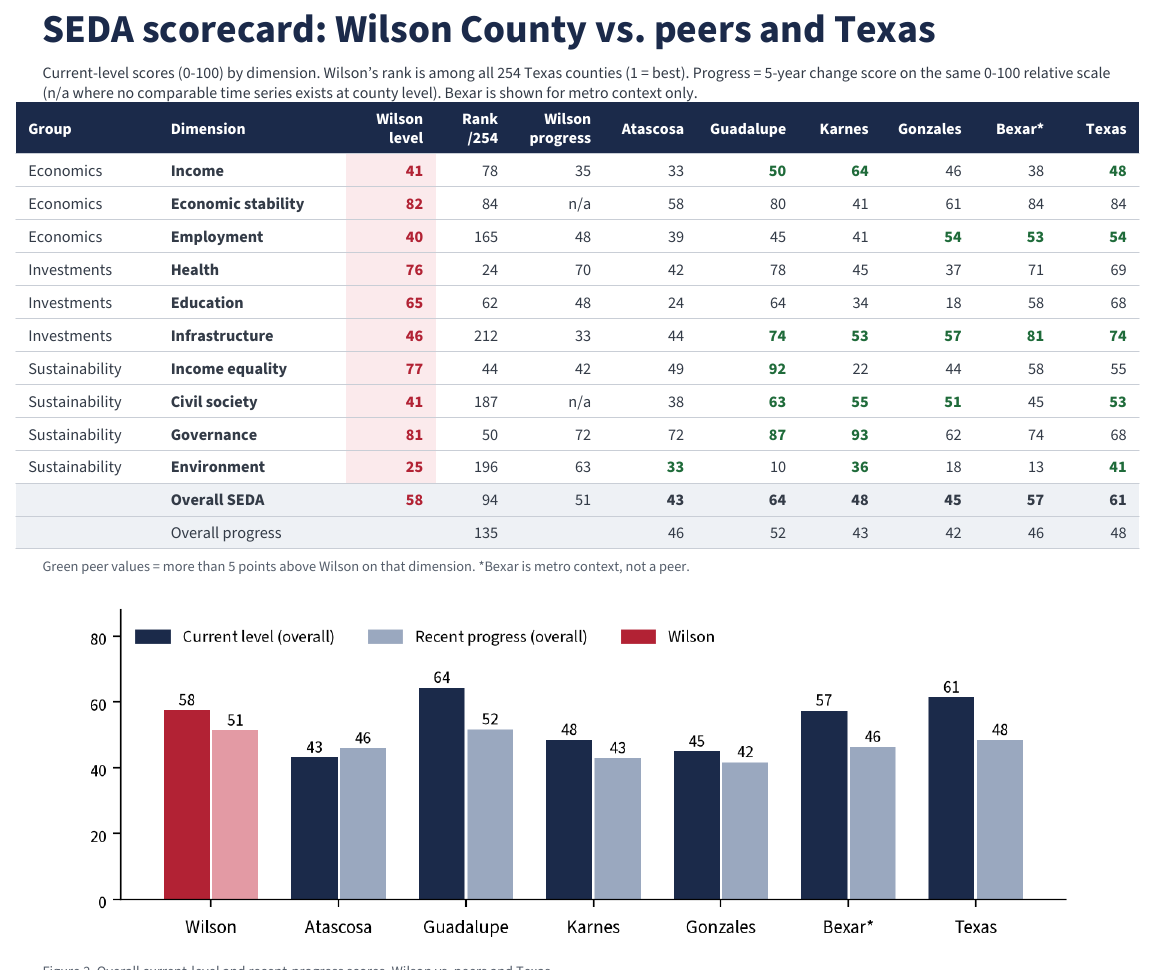
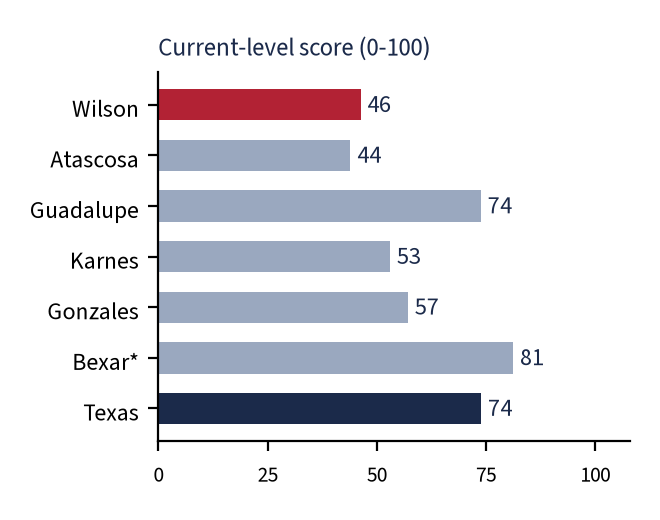
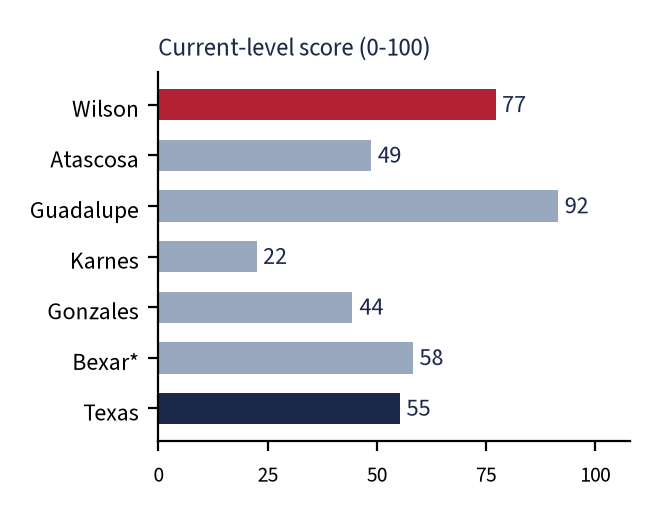
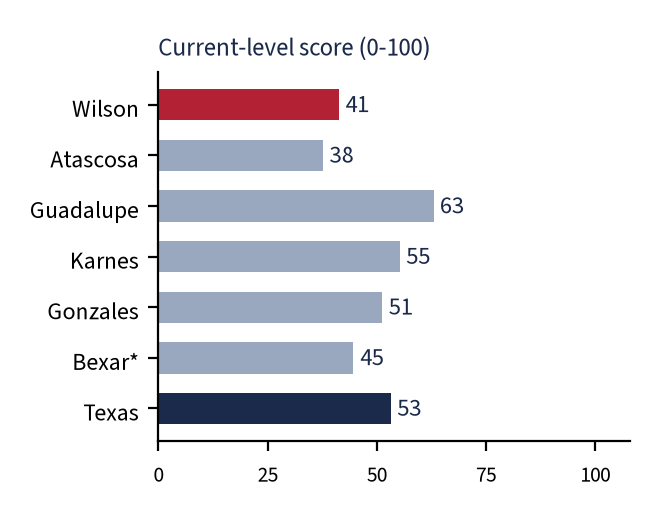
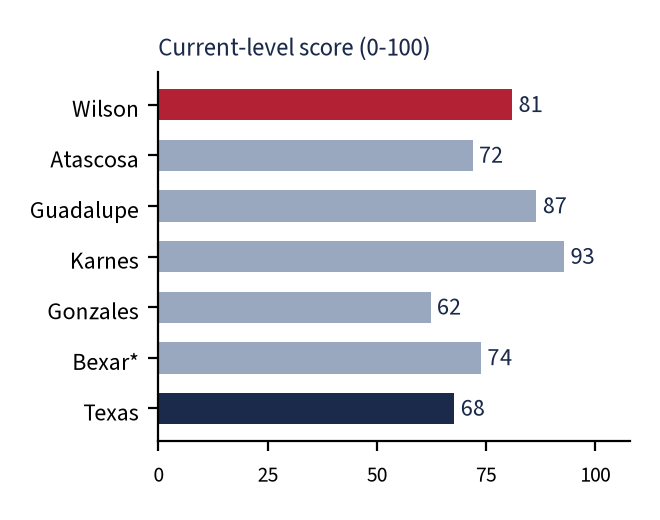
The table below shows current-level scores (0-100) for each dimension. Wilson’s rank is among all 254 Texas counties (1 = best). “Progress” is a 5-year change score on the same relative scale. Bexar County is shown for metro context only, not as a peer.
| Dimension | Wilson level | Wilson rank /254 | Wilson progress | Atascosa | Guadalupe | Karnes | Gonzales | Bexar* | Texas |
|---|---|---|---|---|---|---|---|---|---|
| Income Economics | 41 | 78 | 35 | 33 | 50 | 64 | 46 | 38 | 48 |
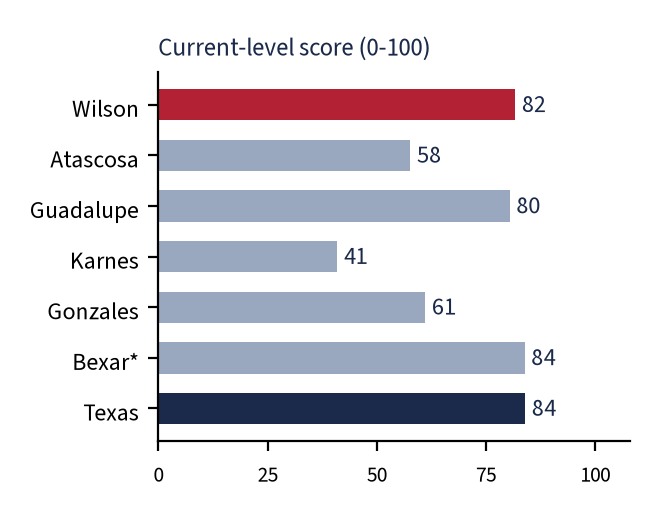
| Economic stability Economics | 82 | 84 | n/a | 58 | 80 | 41 | 61 | 84 | 84 |
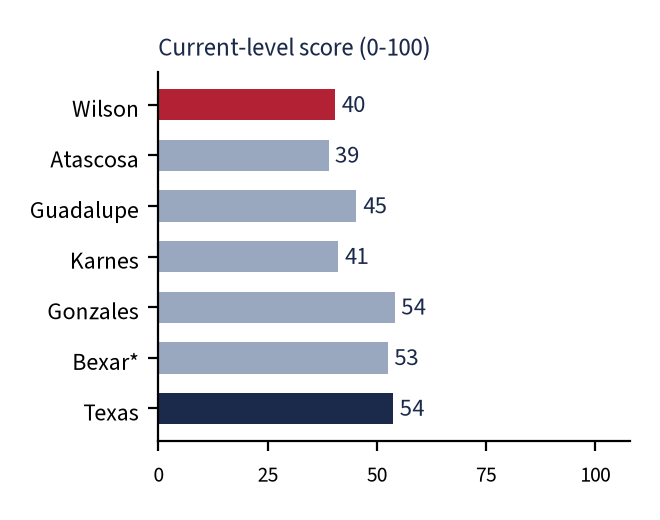
| Employment Economics | 40 | 165 | 48 | 39 | 45 | 41 | 54 | 53 | 54 |
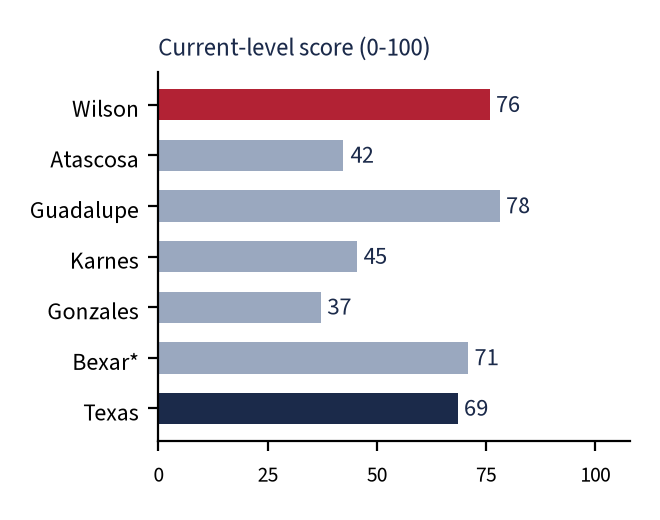
| Health Investments | 76 | 24 | 70 | 42 | 78 | 45 | 37 | 71 | 69 |
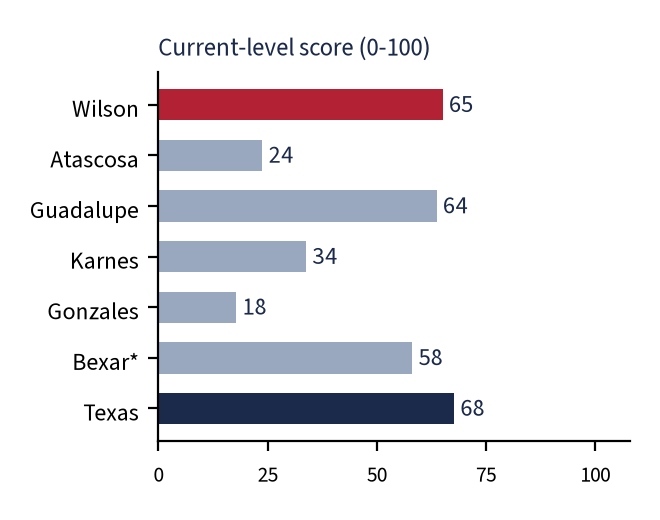
| Education Investments | 65 | 62 | 48 | 24 | 64 | 34 | 18 | 58 | 68 |
| Infrastructure Investments | 46 | 212 | 33 | 44 | 74 | 53 | 57 | 81 | 74 |
| Income equality Sustainability | 77 | 44 | 42 | 49 | 92 | 22 | 44 | 58 | 55 |
| Civil society Sustainability | 41 | 187 | n/a | 38 | 63 | 55 | 51 | 45 | 53 |
| Governance Sustainability | 81 | 50 | 72 | 72 | 87 | 93 | 62 | 74 | 68 |
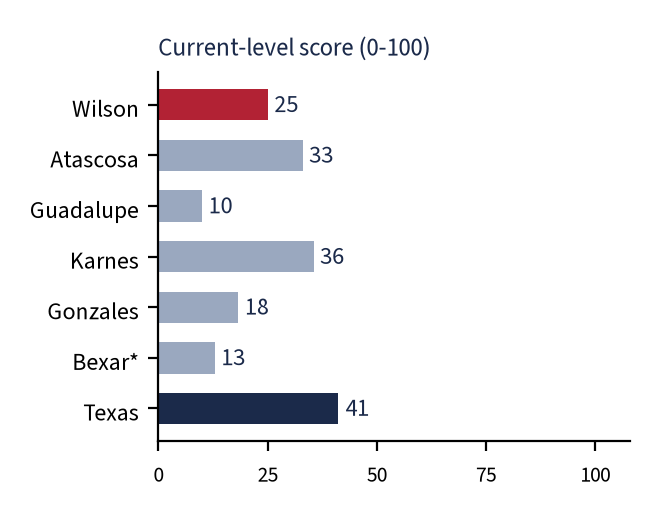
| Environment Sustainability | 25 | 196 | 63 | 33 | 10 | 36 | 18 | 13 | 41 |
| Overall SEDA | 58 | 94 | 51 | 43 | 64 | 48 | 45 | 57 | 61 |
| Overall progress | 135 | 46 | 52 | 43 | 42 | 46 | 48 |
*Bexar is metro context, not a peer. Progress is n/a where no comparable county time series exists.
A printable version of the scorecard and chart, as it appears in the full report:
The ten dimensions
SEDA groups its ten dimensions into three families: Economics (income, stability, jobs), Investments (health, education, infrastructure) and Sustainability (equality, civil society, governance, environment). Each section below shows Wilson’s score, how it compares with the peer counties, the indicators behind it, and what it means for Precinct 4.
Economics Income
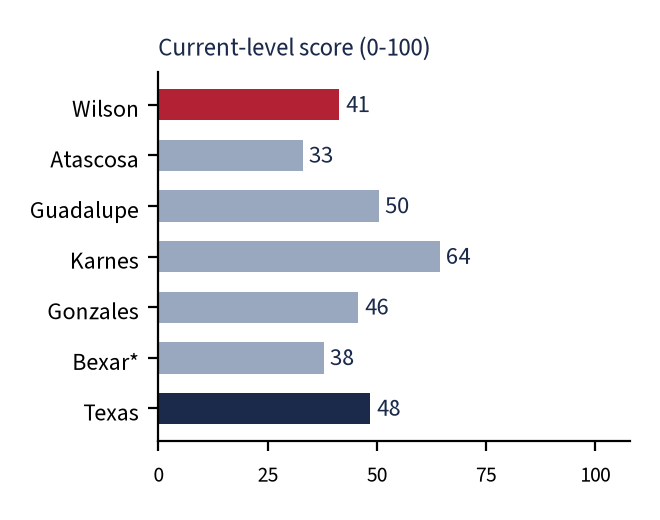
Current level: 41/100 (rank 78 of 254) · 5-year progress: 35/100 (rank 160 of 254)
| Indicator | Year | Wilson | Texas | Source |
|---|---|---|---|---|
| Current level | ||||
| Per-capita personal income | 2024 | $61,373 | $69,823 | S1 |
| Median household income | 2020-24 | $94,565 | $78,476 | S5 |
| GDP per resident (current $) | 2024 | $30,776 | $88,517 | S2 |
| 5-year progress | ||||
| Per-capita income growth | 2019-24 | +22.4% | +31.1% | S1 |
| Median household income change | 2015-19 to 2020-24 | +23.3% | +26.8% | S5, S6 |
| Real GDP growth | 2019-24 | +28.5% | +23.0% | S2 |
- Households are well off: median household income of $94,565 is 21% above Texas and ranks 15th of 254 [S5].
- Per-capita personal income ($61,373) is 12% below Texas. That contrast with household income is typical where households are larger and fewer residents have very high incomes or investment income [S1].
- Local output is very low: $30,776 of GDP per resident (rank 242 of 254), because most residents earn their income outside the county [S2, S4].
- Progress is mixed: real GDP grew 28.5% (2019-24; Texas 23.0%), but per-capita income grew only 22.4% (Texas 31.1%) [S2, S1].
Precinct 4: Data are county-wide only. ZIP 78160 (Stockdale) has a median household income of about $64,800 (±$16,547), well below the county figure [S30].
Data note: SEDA uses GDP per capita at purchasing-power parity; no county price index exists, so nominal dollars are used. County GDP for small counties is volatile and revised annually.
Economics Economic stability
Current level: 82/100 (rank 84 of 254) · 5-year progress: n/a (no comparable county time series)
| Indicator | Year | Wilson | Texas | Source |
|---|---|---|---|---|
| Real GDP growth volatility (SD, pp; lower is better) | 2014-24 | 8.3 | 2.9 | S2 |
| Per-capita income growth volatility (SD, pp; lower is better) | 2014-24 | 3.2 | 3.4 | S1 |
| Unemployment-rate volatility (SD, pp; lower is better) | 2016-25 | 0.93 | 1.24 | S3 |
- Unemployment has been comparatively steady: the standard deviation of the annual rate (2016-25) is 0.93 points vs. 1.24 for Texas [S3].
- Per-capita income growth is also steady (3.2-point standard deviation, rank 60) [S1].
- Real GDP growth is more volatile (8.3 points vs. 2.9 statewide), typical of a small economy where single sectors such as energy or construction swing output [S2].
- Inflation is not measured by county. The nearest official gauge, CPI-U for the South region, rose 3.4% from September 2025 to September 2026 [S28]; it affects Wilson residents but is not scored.
Precinct 4: Data are county-wide only; residents’ income stability is tied mainly to the San Antonio metro labor market.
Data note: There is no county inflation series, and no progress score is computed because volatility over short windows is not meaningful.
Economics Employment
Current level: 40/100 (rank 165 of 254) · 5-year progress: 48/100 (rank 129 of 254)
| Indicator | Year | Wilson | Texas | Source |
|---|---|---|---|---|
| Current level | ||||
| Unemployment rate (lower is better) | 2025 | 3.8% | 4.2% | S3 |
| Employment-population ratio, age 16+ | 2020-24 | 57.8% | 61.3% | S5 |
| Self-employed share of workers | 2020-24 | 10.5% | 10.5% | S5 |
| In-county jobs per employed resident | 2025 / 2020-24 | 0.40 | 0.98 | S4, S5 |
| 5-year progress | ||||
| Change in unemployment rate (pp; lower is better) | 2019-25 | +0.72 | +0.67 | S3 |
| Change in employment-population ratio (pp) | 2015-19 to 2020-24 | +1.6 | +0.4 | S5, S6 |
| Covered-job growth | 2019-25 | +7.2% | +12.1% | S4 |
- Unemployment averaged 3.8% in 2025 vs. 4.2% statewide; it ran 3.6-4.5% in January-August 2026 (not seasonally adjusted) [S3].
- Only 57.8% of residents 16 and older are employed (Texas 61.3%), partly reflecting an older population (17% aged 65+) [S5, S8].
- The local job base is thin: 9,592 covered jobs in 2025 (+7.2% since 2019; Texas +12.1%), paying an average of $53,339 vs. $77,964 statewide [S4].
- Self-employment is 10.5% of workers, down from 11.7% in 2015-19 [S5, S6].
Precinct 4: Data are county-wide only. Commuting data suggest Precinct 4’s FM 775 subdivisions are especially dependent on metro jobs; rural Stockdale-area employment leans on agriculture, energy and schools (not quantified by precinct).
Data note: The 2025 unemployment average uses 11 months (October 2025 was not published). Covered-employment data exclude most self-employed workers and farm proprietors.
Investments Health
Current level: 76/100 (rank 24 of 254) · 5-year progress: 70/100 (rank 50 of 254)
| Indicator | Year | Wilson | Texas | Source |
|---|---|---|---|---|
| Current level | ||||
| Uninsured, under 65 (lower is better) | 2023 | 13.2% | 18.6% | S7 |
| Primary care physicians per 100k | 2022 | 40 | 61 | S7 |
| Life expectancy (years) | 2021-23 | 77.0 | 77.2 | S7 |
| Premature death, YPLL per 100k (lower is better) | 2021-23 | 7,723 | 7,960 | S7 |
| Adults in poor/fair health (lower is better) | 2023 | 20.2% | 23.2% | S7 |
| 5-year progress | ||||
| Change in uninsured rate (pp; lower is better) | 2015-19 to 2020-24 | -1.9 | -0.1 | S5, S6 |
| Change in premature death rate (lower is better) | 2016-18 to 2021-23 | +15.1% | +19.7% | S9, S7 |
- Coverage is a relative strength: 13.2% of under-65 residents are uninsured vs. 18.6% statewide (rank 17) [S7]; the Census survey rate fell from 12.9% to 11.0% [S5, S6].
- Access to clinicians is thinner: 40 primary-care physicians per 100,000 residents vs. 61 statewide [S7].
- Outcomes are near or better than Texas: life expectancy 77.0 years (Texas 77.2); premature death 7,723 years of potential life lost per 100,000 (Texas 7,960) [S7].
- Premature death rose 15% between 2016-18 and 2021-23, less than the 20% statewide rise (pandemic-era mortality) [S9, S7]. Motor-vehicle crash deaths are 19.1 per 100,000 vs. 13.8 statewide [S7].
Precinct 4: Data are county-wide. ZIP 78160 (Stockdale) shows an uninsured rate near 18.7% vs. 11.0% county-wide (wide margin of error) [S30].
Data note: Hospital and EMS response times and travel distance to care are not available in a comparable public dataset.
Investments Education
Current level: 65/100 (rank 62 of 254) · 5-year progress: 48/100
| Indicator | Year | Wilson | Texas | Source |
|---|---|---|---|---|
| Current level | ||||
| Adults 25+ with HS diploma or more | 2020-24 | 89.8% | 86.0% | S5 |
| Adults 25+ with bachelor’s or more | 2020-24 | 25.9% | 33.8% | S5 |
| TEA A-F district score (enrollment-weighted) | 2026 (prelim.) | 83.3 | 82.4 | S10 |
| 5-year progress | ||||
| Change in HS+ attainment (pp) | 2015-19 to 2020-24 | +2.3 | +2.3 | S5, S6 |
| Change in BA+ attainment (pp) | 2015-19 to 2020-24 | +4.1 | +3.9 | S5, S6 |
| Change in TEA district score (pts) | 2019 to 2026 | -4.8 | -4.7 | S10 |
- Attainment is solid at the base: 89.8% of adults hold a high-school diploma (Texas 86.0%); 25.9% hold a bachelor’s degree (Texas 33.8%), up 4.1 points [S5, S6].
- All four ISDs rated A or B in TEA’s preliminary 2026 ratings: Poth A (91), La Vernia B (84), Stockdale B (82), Floresville B (81). The enrollment-weighted average is 83.3 vs. 82.4 for all Texas ISDs [S10].
- Compared with 2019 (before the 2023 refresh of the A-F system), scores fell 4.8 points, about the statewide decline (4.7); Stockdale ISD rose from 74 (2024) to 82 (2026) [S10].
- Commissioners have no direct authority over ISDs; county roles are indirect (roads and bus routes, libraries, workforce partnerships).
Precinct 4: Stockdale ISD (B, 82) serves most of Precinct 4; La Vernia (B, 84) and Floresville (B, 81) serve the FM 775 arm. Poth ISD (A, 91) is in Precinct 2.
Data note: 2026 TEA ratings are preliminary (final after appeals, scheduled for December 2026). The 2023 A-F refresh limits comparability with 2019.
Investments Infrastructure
Current level: 46/100 (rank 212 of 254) · 5-year progress: 33/100 (rank 208 of 254)
| Indicator | Year | Wilson | Texas | Source |
|---|---|---|---|---|
| Current level | ||||
| Households with broadband subscription | 2020-24 | 88.1% | 91.4% | S5 |
| Occupied homes lacking complete plumbing (lower is better) | 2020-24 | 0.75% | 0.48% | S5 |
| Workers commuting 45+ minutes (lower is better) | 2020-24 | 35.5% | 16.9% | S5 |
| 5-year progress | ||||
| Change in broadband subscription (pp) | 2015-19 to 2020-24 | +5.4 | +9.5 | S5, S6 |
| Change in 45+ minute commuters (pp; lower is better) | 2015-19 to 2020-24 | +0.1 | -0.4 | S5, S6 |
- Commuting is the county’s largest infrastructure burden: 35.5% of workers travel 45 minutes or more (rank 250 of 254); the mean commute is 34.5 minutes vs. 26.7 statewide [S5].
- Broadband subscription is 88.1% of households (Texas 91.4%), and grew only 5.4 points since 2015-19 vs. 9.5 statewide (rank 225) [S5, S6].
- Countywide crashes rose from 558 (2019) to 646 (2025); injury-severity crashes rose from 140 to 224 [S20].
- Water: the 2026 Region L plan projects Wilson water-user-group shortages totaling roughly 960 acre-feet per year in 2030 and 2,490 by 2080 (largest: Oak Hills WSC, 531 rising to 1,568), against county demand of 28,061 acre-feet per year in 2030 [S18]. Wilson relies on the Carrizo-Wilcox aquifer managed by Evergreen UWCD [S19].
Precinct 4: Precinct 4 is served by US 87, SH 123, SH 97, FM 1681 and FM 775 and contains the Clear Fork Creek Solar site (about 6,100 acres), so construction-related road wear and land-use effects from that project are concentrated there. The proposed Misae complex is in Precinct 3 and the proposed 3Di campus is in Precinct 2 [S31, S32]. ZIP 78160 broadband subscription is about 84.9% vs. 88.1% county-wide [S30].
Data note: FCC broadband availability data and county road-condition data were not retrievable in a comparable form; TxDOT does not publish crashes by commissioner precinct. Lacking-plumbing estimates have large margins of error.
Sustainability Income equality
Current level: 77/100 (rank 44 of 254) · 5-year progress: 42/100 (rank 176 of 254)
| Indicator | Year | Wilson | Texas | Source |
|---|---|---|---|---|
| Current level | ||||
| Gini index, household income (lower is better) | 2020-24 | 0.427 | 0.478 | S5 |
| Income ratio, 80th/20th percentile (lower is better) | 2020-24 | 4.38 | 4.81 | S7 |
| Poverty rate (lower is better) | 2020-24 | 11.3% | 13.8% | S5 |
| Child poverty (lower is better) | 2023 | 13.8% | 18.4% | S8 |
| 5-year progress | ||||
| Change in Gini index (lower is better) | 2015-19 to 2020-24 | -0.003 | -0.001 | S5, S6 |
| Change in poverty rate (pp; lower is better) | 2015-19 to 2020-24 | +1.7 | -0.9 | S5, S6 |
- Income is more evenly distributed than in Texas overall: Gini 0.427 vs. 0.478; 80/20 income ratio 4.38 vs. 4.81 [S5, S7].
- Poverty (11.3%) and child poverty (13.8%) are below Texas (13.8% and 18.4%) [S5, S8].
- But poverty rose 1.7 points between the 2015-19 and 2020-24 Census surveys, while it fell 0.9 points statewide (progress rank 200) [S5, S6].
Precinct 4: ZIP 78160 (Stockdale) poverty is roughly 23% vs. 11% county-wide (wide margin of error) [S30], the clearest Precinct 4 equity gap in the data.
Data note: Census change estimates for a county of about 55,000 have overlapping confidence intervals; treat the poverty increase as a signal to monitor.
Sustainability Civil society
Current level: 41/100 (rank 187 of 254) · 5-year progress: n/a (no comparable county time series)
| Indicator | Year | Wilson | Texas | Source |
|---|---|---|---|---|
| Social associations per 10k residents | 2023 | 5.9 | 7.3 | S7 |
| Voter turnout, citizen voting-age population | 2020 | 67.6% | 60.9% | S8 |
| Gender pay gap, |1 - F/M earnings ratio| (lower is better) | 2020-24 | 0.246 | 0.193 | S7 |
| Homicide deaths per 100k (lower is better) | 2017-23 | 10.8 | 6.7 | S7 |
- Civic participation is high: 2024 general-election turnout was 70.33% of registered voters (27,515 of 39,123) vs. 61.15% statewide [S16, S15]; citizen voting-age turnout in 2020 was 67.6% (Texas 60.9%) [S8].
- Organized community life is thinner: 5.9 membership associations per 10,000 residents vs. 7.3 statewide (rank 203) [S7].
- Women’s median earnings are 0.75 of men’s (Texas 0.81) [S7].
- Homicide deaths averaged 10.8 per 100,000 in 2017-23 (39 deaths over seven years) vs. 6.7 statewide [S7]. Small counts make this rate unstable.
Precinct 4: Turnout in Precinct 4 boxes cannot be computed from the county’s posted precinct report (registered voters shown as 0). County-wide figures apply.
Data note: Violent and property crime rates were not available from a comparable official county dataset.
Sustainability Governance
Current level: 81/100 (rank 50 of 254) · 5-year progress: 72/100 (rank 84 of 254)
| Indicator | Year | Wilson | Texas | Source |
|---|---|---|---|---|
| Current level | ||||
| County tax-supported debt per resident (lower is better) | FY2025 | $81 | $531 | S11 |
| County property tax rate per $100 (lower is better) | TY2025 | 0.4060 | 0.4928 | S12 |
| Adopted rate vs. no-new-revenue rate (lower is better) | TY2025 | +4.6% | +4.3% | S12 |
| 5-year progress | ||||
| Change in county debt per resident (lower is better) | FY2019-FY2025 | -$56 | +$109 | S11 |
- Debt is low: about $81 of tax-supported county debt per resident in FY2025 ($4.47 million), down from $137 in FY2019; the county-sector average is $531 [S11, S1].
- The 2025 county rate is $0.405961 per $100 (2024: $0.414748), below the statewide county median of $0.4928 [S12, S13].
- The adopted 2025 rate is 4.6% above the no-new-revenue rate ($0.388265), close to the statewide county median (+4.3%) [S12, S13].
- The 2026 abatement-policy update added a development-agreement requirement and full-court review, strengthening accountability tools for large projects [S24].
Precinct 4: Data are county-wide. Precinct 4 hosts the only active abatement (Clear Fork Solar), so compliance reporting on that agreement is precinct-relevant.
Data note: SEDA’s governance dimension uses World Bank indicators that have no county equivalent; these fiscal proxies are the weakest part of the adaptation and embed value choices (lower rate and debt are scored as better). Texas figures in this table are the county-sector average (debt) and statewide county medians (rate).
Sustainability Environment
Current level: 25/100 (rank 196 of 254) · 5-year progress: 63/100 (rank 90 of 254)
| Indicator | Year | Wilson | Texas | Source |
|---|---|---|---|---|
| Current level | ||||
| Fine particulate matter PM2.5, µg/m³ (lower is better) | 2020 | 8.6 | 8.1 | S8 |
| FEMA National Risk Index score, national percentile (lower is better) | Dec 2025 | 75.5 | n/a | S17 |
| 5-year progress | ||||
| Change in PM2.5, µg/m³ (lower is better) | 2015 to 2020 | -0.50 | +0.05 | S9, S8 |
- Fine-particle air pollution averaged 8.6 µg/m³ (2020) vs. 8.1 statewide, improved from 9.1 in 2015 [S8, S9].
- FEMA’s National Risk Index scores Wilson at 75.5 (national percentile; rated “Relatively Low”); drought and hail are the main moderate hazards [S17].
- Pressure on land and water is rising: the 2026 Region L plan shows county population growing about 55% by 2080 [S18]; recent solar and data-center proposals would convert thousands of acres of agricultural land [S23, S26, S25].
Precinct 4: Precinct 4 hosts the Clear Fork solar footprint (about 6,100 acres), so that project’s land-use effects are concentrated there. The proposed Misae complex north of Stockdale is in Precinct 3 [S31]; groundwater permitting is handled by Evergreen UWCD [S19].
Data note: There is no EPA air monitor in Wilson County (PM2.5 is modeled). Groundwater-level trends and land-conversion acreage were not compiled into scored indicators.
What it means for Precinct 4
Precinct 4 covers the eastern and northeastern part of the county: Stockdale and the US 87 / SH 123 / FM 1681 / SH 97 corridors toward the Gonzales and Karnes county lines, plus a western arm of subdivisions along FM 775 between La Vernia and Floresville [S21]. In the March 3, 2026 primary, the Commissioner Precinct 4 contest appeared on election boxes 414 (Stockdale), 415 (Life Church / FM 775) and 416 (Wood Valley) [S22]. Poth is not in Precinct 4; the county map places it in Precinct 2, and the city of La Vernia sits in Precinct 3 [S21].
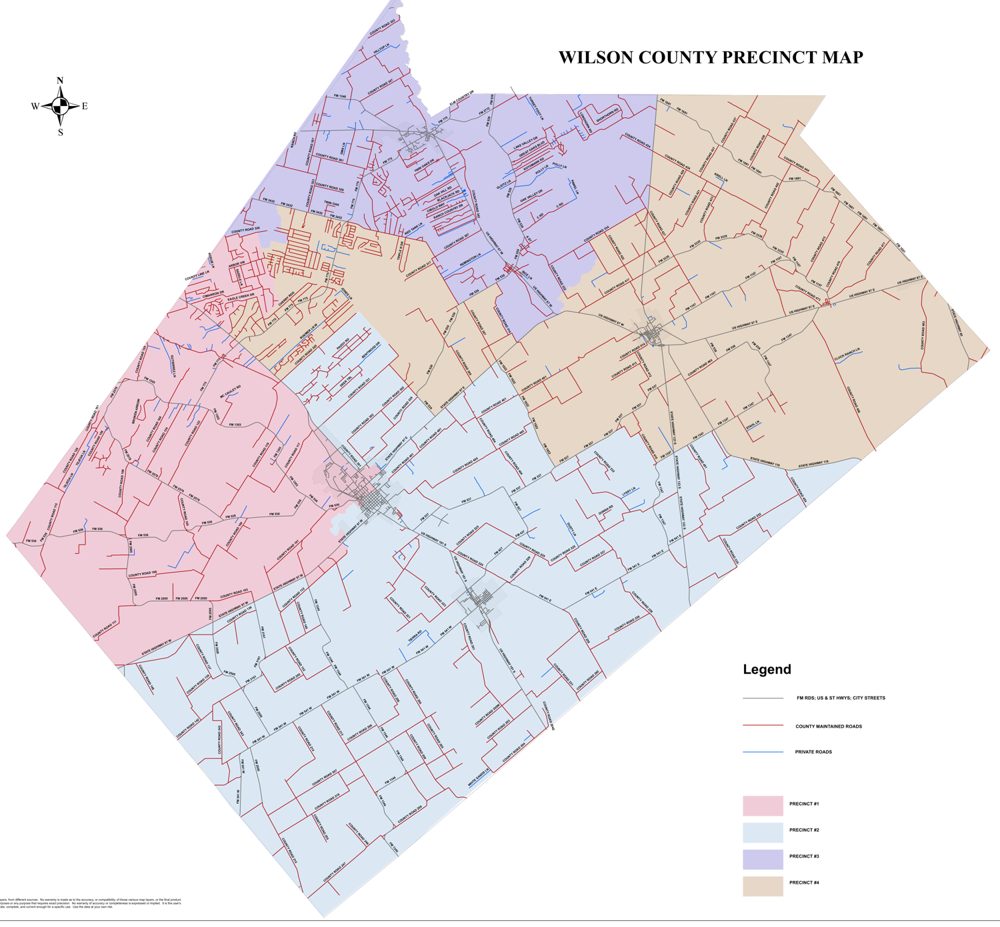
No official source publishes economic statistics by commissioner precinct, so nearly every number in this assessment is county-wide. As a rough proxy, the Census Bureau’s ZIP-code estimates for 78160 (Stockdale) can be compared with the neighboring ZIPs. ZIP and precinct boundaries do not match, and small-area margins of error are large.
| Area | Precinct (approx.) | Population | Median household income | Poverty | Uninsured | Broadband | Commute 45+ min |
|---|---|---|---|---|---|---|---|
| 78160 Stockdale | Pct 4 core | 4,885 | $64,800 (±$16,547) | 23.0% | 18.7% | 84.9% | 34.3% |
| 78121 La Vernia | Pct 3 / part Pct 4 | 16,120 | $120,048 (±$10,416) | 8.0% | 8.4% | 93.7% | 40.3% |
| 78114 Floresville | Pct 1/2 / part 3-4 | 24,283 | $88,087 (±$6,903) | 9.4% | 12.1% | 85.6% | 33.9% |
| 78147 Poth | Pct 2 | 1,532 | $72,404 (±$19,076) | 5.8% | 4.5% | 85.7% | 14.7% |
| Wilson County | All | 52,781 | $94,565 | 11.3% | 11.0% | 88.1% | 35.5% |
What the numbers suggest:
- Two very different communities. The Stockdale-area ZIP shows markedly higher poverty and uninsured rates and lower median income than the county as a whole, with commute burdens similar to the county average. The FM 775 subdivisions in Precinct 4’s western arm resemble the higher-income La Vernia and Floresville ZIPs [S30]. Precinct 4 therefore contains both the county’s most rural, lower-income area and fast-growing commuter subdivisions.
- Roads carry the load. US 87, SH 123, SH 97, FM 1681 and FM 775 serve the precinct and the Clear Fork Creek Solar site, so construction-related road wear from that project is concentrated there, while county-wide injury-severity crashes have risen from 140 to 224 since 2019 [S20].
- Big land-use decisions are here and nearby. Precinct 4 hosts the county’s largest approved solar project, Clear Fork Creek Solar. The proposed Misae complex north of Stockdale is in Precinct 3, and the proposed 3Di data-center campus near Floresville is in Precinct 2 [S31, S32]. These projects are described below.
Development in or near Precinct 4
- Clear Fork Creek Solar: 600 MW on about 6,100 acres along both sides of US 87 in Precinct 4; about $800 million; a 10-year county abatement was approved unanimously July 14, 2025. An estimated 6 permanent jobs (about $70,000) and about 600 construction jobs; the agreement includes 300-foot setbacks, groundwater and remediation/performance-bond provisions, and annual certification [S23, S27].
- Proposed Misae data center / solar / gas complex (Precinct 3): about 6 miles north of Stockdale on CR 428, in Precinct 3 per the county record [S31]; a 500-MW initial interconnection request, a 180-MW gas plant standard permit and a roughly 2,200-acre, 525-MW solar component. The developer cites about 15,000 gallons per day of water use when built and 200+ permanent jobs, while residents cited earlier website references to 2 million gallons per day; construction is targeted for 2027 [S26].
- Proposed Floresville Technology Campus (3Di, Precinct 2): a hyperscale data center with on-site natural-gas generation proposed at 2517 CR 302, Floresville; the developer describes the site as Precinct 2 [S32].
- County abatement policy (amended March 9, 2026): now requires a development agreement (permits, regulations, standards) and a full-court completeness review; as of March 2026 only one developer (Clear Fork) had applied since 2025 [S24, S27]. In July 2026 the court took no action on a 145-MW Moonstone Solar application (3 jobs; no water rights acquired) [S25].
Policy ideas a commissioner can act on
Texas commissioners courts control county roads and bridges, the county budget and tax rate, county debt, abatement and development agreements (Tax Code Ch. 312; Local Government Code Ch. 381), subdivision rules and public-safety funding. They do not control school districts, groundwater permitting (Evergreen UWCD) or most state permits (TCEQ). Each idea below is tied to the indicators that would show whether it works.
Road-use and road-repair agreements for every large project
Require road-use, haul-route and repair/bonding terms (with pre- and post-construction road surveys) in development and abatement agreements, and publish a county road capital plan with a pavement-condition baseline, starting with corridors serving large solar and data-center sites, including Precinct 4 roads near the Clear Fork Creek Solar site.
Indicators to track (baseline): Workers commuting 45+ min (35.5%); injury-severity crashes (224 in 2025); motor-vehicle crash deaths (19.1 per 100k) [S5, S20, S7]
Performance-based incentives with clawbacks
Build on the 2026 abatement policy: tie any abatement to verified job counts, wage floors (for example, at or above county average pay), local-hiring reporting and value thresholds, with pro-rata clawback and recapture if targets are missed; post annual compliance certifications online.
Indicators to track (baseline): In-county jobs per employed resident (0.40); average pay ($53,339); covered-job growth (+7.2%) [S4, S5, S27]
Water-use disclosure and coordination
Require projected water use, source and drought contingency in abatement and development applications; formalize data sharing with Evergreen UWCD and Region L; support shortfall projects for suppliers with identified needs (for example, Oak Hills WSC).
Indicators to track (baseline): Region L shortages (about 960 acre-feet/yr in 2030, about 2,490 by 2080); population growth to 86,407 by 2080 [S18, S19]
Broadband gap closure
Map unserved addresses using FCC and Texas Broadband Development Office data, streamline county right-of-way permits, and partner with providers and cooperatives on state and federal grant applications prioritizing rural Precinct 4.
Indicators to track (baseline): Broadband subscription (88.1%; +5.4 pts vs. +9.5 statewide); ZIP 78160 about 84.9% [S5, S6, S30]
Budget transparency and fiscal reporting
Apply for Comptroller Transparency Stars (traditional finances, debt, economic development); publish an online check register, abatement compliance and PILOT receipts, and a plain-language budget summary each year at rate adoption.
Indicators to track (baseline): Debt per resident ($81); adopted rate vs. no-new-revenue rate (+4.6%) [S11, S12, S13]
Public safety and emergency services planning
Use crash and fatality data to target enforcement and engineering on high-crash county roads; coordinate fire marshal, ESD and sheriff planning for new industrial sites (fire suppression, hazmat, access roads) as a condition of development agreements.
Indicators to track (baseline): Homicide rate (10.8 per 100k); motor-vehicle crash deaths; crash trend [S7, S20, S26]
Workforce and local-hiring pipeline
Convene ISDs, area community colleges and employers on career and technical education and apprenticeship pathways linked to energy, construction and health jobs; make local-hire reporting part of incentive agreements.
Indicators to track (baseline): Employment-population ratio (57.8%); self-employment trend (11.7% to 10.5%); bachelor’s attainment (25.9%) [S5, S6]
Primary-care access in rural areas
Work with local hospital and clinic providers on rural clinic hours, telehealth sites (for example, libraries and community centers) and EMS coverage in eastern Wilson County.
Indicators to track (baseline): Primary-care physicians (40 per 100k vs. 61 statewide); ZIP 78160 uninsured about 18.7% [S7, S30]
These options are public-policy choices supported by the indicators; they are not assessments of any official or candidate. Legal authority for specific terms should be confirmed with the County Attorney.
Methodology and sources
How the scores work
BCG’s SEDA rates national well-being across ten dimensions in three groups, using roughly 40 public indicators, each normalized to 0-100 [S29]. Many national indicators (inflation, governance indices, freedom) do not exist at the county level, so this assessment substitutes 2-5 measurable county indicators per dimension from federal and Texas sources (Census ACS, BEA, BLS, County Health Rankings, TEA, the Texas Comptroller, the Bond Review Board, FEMA and Region L).
- Each indicator is scaled 0-100 against all 254 Texas counties: the 5th-percentile county = 0 and the 95th-percentile county = 100 (values beyond are capped). Indicators where lower is better (such as unemployment or poverty) are inverted. GDP per resident is log-scaled because oil- and gas-producing counties create extreme outliers.
- A dimension score is the simple average of its indicator scores; the overall SEDA score is the simple average of the ten dimensions (BCG’s equal-weight convention). Texas statewide values are scored on the same scale for reference.
- Current level uses the latest release available on October 16, 2026. Progress compares the latest data with a baseline about five years earlier (ACS 2015-19 vs. 2020-24; BEA 2019 vs. 2024; BLS 2019 vs. 2025, chosen to avoid the 2020 pandemic trough; TEA 2019 vs. 2026).
- Scores show relative position, not absolute adequacy. Peer counties (Atascosa, Guadalupe, Karnes and Gonzales) were chosen by the campaign as rural and exurban neighbors; Bexar is shown for metro context only.
Limitations
- Precinct-level data do not exist in official economic, health or crash datasets; all scores are county-wide, and ZIP-code estimates are a rough Precinct 4 proxy only.
- Small-sample uncertainty: Census and mortality estimates for a county of about 55,000 (and ZIPs of about 5,000) have wide margins of error, so differences of a few points are not meaningful.
- Inflation is not measured by county; violent and property crime rates, broadband availability and road condition were not available in comparable form.
- The governance dimension relies on fiscal proxies (debt, tax rate, rate vs. no-new-revenue) that embed value judgments.
- Data years differ: ACS 2020-24, BEA 2024, BLS 2025, County Health Rankings measures 2020-2023, TEA 2026 (preliminary). Karnes and Gonzales GDP figures are inflated by oil and gas output.
The framework is adapted from Boston Consulting Group’s SEDA; this assessment was prepared for the Mark Hurd for County Commissioner campaign and is not produced or endorsed by BCG.
Download the full assessment (PDF, 20 pages)
Sources
- S1. U.S. Bureau of Economic Analysis (BEA), CAINC1 County personal income, population and per-capita personal income, 1969-2024 (accessed Oct 16, 2026). apps.bea.gov
- S2. BEA, CAGDP1 County GDP summary (real GDP, chained 2017$; current-dollar GDP), 2001-2024. apps.bea.gov
- S3. U.S. Bureau of Labor Statistics (BLS), Local Area Unemployment Statistics, county series LAUCN484930000000003 etc. (not seasonally adjusted; 2025 = mean of 11 published months, Oct 2025 not published). www.bls.gov
- S4. BLS, Quarterly Census of Employment and Wages, annual averages, all-ownership total covered employment and pay, 2019 and 2025. data.bls.gov
- S5. U.S. Census Bureau, American Community Survey 2020-2024 5-year estimates (tables B01003, B15003, B17001, B19013, B19083, B23025, B24080, B25048, B27010, B28002, B08303, B08013), retrieved via Census Reporter API. censusreporter.org
- S6. U.S. Census Bureau, ACS 2015-2019 5-year table-based summary files (same tables) - baseline for 5-year change. www2.census.gov
- S7. County Health Rankings & Roadmaps (CHR&R), Supplemental Data Release, March 25, 2026 (analytic CSV; measure years per codebook). www.countyhealthrankings.org
- S8. CHR&R 2025 Annual Data Release analytic data (v3) and 2025 Technical Documentation (measure years). www.countyhealthrankings.org
- S9. CHR&R 2025 trends dataset (premature death 2016-2018; PM2.5 2015). www.countyhealthrankings.org
- S10. Texas Education Agency (TEA), 2026 Statewide Multi-Year Ratings spreadsheet (2026 ratings preliminary, released Aug 14, 2026; final after appeals). tea.texas.gov
- S11. Texas Bond Review Board, Debt Outstanding by Local Government (data.texas.gov dataset dyv5-3bjd), counties FY2019 and FY2025. data.texas.gov
- S12. Texas Comptroller of Public Accounts, 2025 County Rates and Levies (total county rate, no-new-revenue rate, levy). comptroller.texas.gov
- S13. Wilson County, 2025 Truth-in-Taxation Summary (Tax Code Sec. 26.16). www.co.wilson.tx.us
- S14. Texas Secretary of State, November 2024 Voter Registration Figures (by county). www.sos.state.tx.us
- S15. Texas Secretary of State, Turnout and Voter Registration Figures (1970-current), Nov 2024 statewide turnout. www.sos.state.tx.us
- S16. Transparency USA, 2024 General Election county turnout (final/certified SOS turnout data), Wilson and peer county pages. turnout.transparencyusa.org
- S17. FEMA National Risk Index, county data (version December 2025), via FEMA ArcGIS service. hazards.fema.gov
- S18. South Central Texas (Region L) Water Planning Group, 2026 Regional Water Plan (adopted; WUG population, demand, needs reports dated Oct 15, 2025). regionltexas.org
- S19. Evergreen Underground Water Conservation District, 2025 Groundwater Management Plan (adopted). evergreenuwcd.org
- S20. TxDOT Crash Records Information System, "Crashes and Injuries by County" 2019 and 2025 (2025 processed as of Apr 7, 2026). www.txdot.gov
- S21. Wilson County, Commissioner Precinct Map (2021 redistricting). www.co.wilson.tx.us
- S22. Wilson County Elections, March 3, 2026 Primary Official PCT-by-PCT results (Commissioner Pct 4 race on boxes 414-416). www.co.wilson.tx.us
- S23. Wilson County News, "Wilson County approves solar farm tax abatement," July 15, 2025. www.wilsoncountynews.com
- S24. Wilson County News, "County approves tax abatement policy changes," March 10, 2026. www.wilsoncountynews.com
- S25. Wilson County News, "Commissioners: No tax deal for Moonstone Solar," July 28, 2026. www.wilsoncountynews.com
- S26. Wilson County News, "Misae founder aims to alleviate data center project concerns," March 10, 2026. www.wilsoncountynews.com
- S27. Wilson County Tax Abatement Policy (as amended March 9, 2026). www.co.wilson.tx.us
- S28. BLS, CPI-U South Region all items (CUUR0300SA0), Sept 2026 vs Sept 2025. www.bls.gov
- S29. Boston Consulting Group, SEDA methodology ("From Wealth to Well-being," 2012; SEDA 2019). www.bcg.com
- S30. U.S. Census Bureau, ACS 2020-2024 5-year, ZIP Code Tabulation Areas 78160, 78121, 78114, 78147 (via Census Reporter). censusreporter.org
- S31. Wilson County records produced under the Texas Public Information Act, "Re: city water and sewer" email thread, June 28, 2025 (county reply: "The area in question is in Precinct Three").
- S32. Wilson County records produced under the Texas Public Information Act, "FW: Floresville Technology Campus - Wilson County - Sustainable Development Planning," developer email, May 5, 2026 (site: 2517 County Road 302, "District 2, Precinct 2").
Updated October 17, 2026: corrected the precinct placement of proposed projects to match the county record (Clear Fork Creek Solar is in Precinct 4, the proposed Misae complex is in Precinct 3, and the proposed 3Di campus is in Precinct 2). No scores, ranks or indicator values changed. Web sources accessed October 16, 2026. Census Reporter is a nonprofit interface to official Census Bureau ACS data; Transparency USA republishes Texas Secretary of State turnout data.